
The real estate market activity in Lake Cowichan within Zone 3 – Cowichan Valley for January 2024 reveals some intriguing trends when compared to the same period last year, as well as over the last 12 months. Here’s a detailed analysis:
Current Month vs. Last Year (January 2024 vs. January 2023)
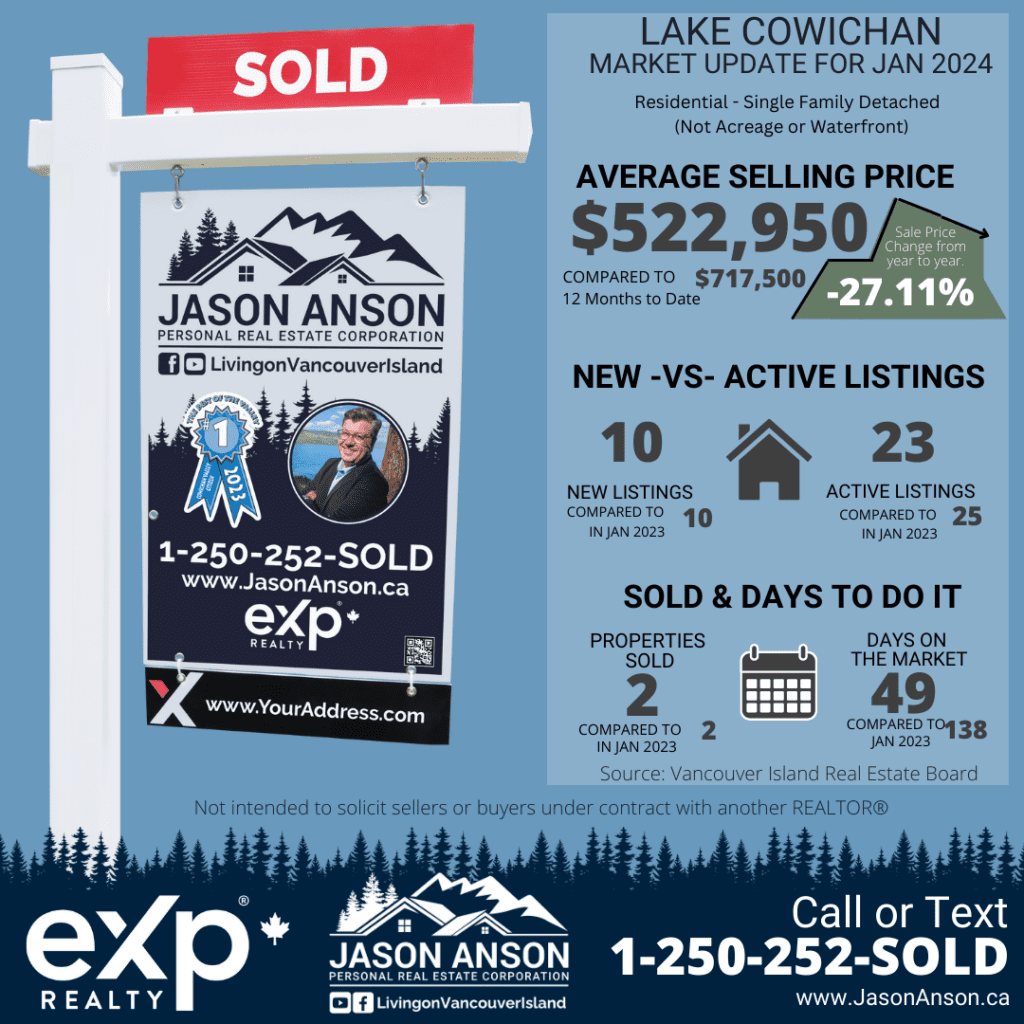
- Units Listed: There has been no change in the number of units listed, with both this year and last year seeing 10 units listed. This stability indicates a consistent level of property listings entering the market at the start of the year.
- Units Reported Sold: Similarly, the number of units reported sold remains unchanged at 2 units, maintaining a sell/list ratio of 20.00%. This suggests a steady demand for single-family detached homes in Lake Cowichan.
- Reported Sales Dollars: There’s a significant decrease of 27.11% in reported sales dollars, dropping from $1,435,000 last year to $1,045,900 this year. This decline reflects a lower average selling price per unit.
- Average Sell Price / Unit: The average selling price per unit has decreased by 27.11% from $717,500 last year to $522,950 this year, indicating a shift in the market towards more affordable housing options or possibly a change in the types of homes being sold.
- Days to Sell: The average days to sell has dramatically decreased by 64.49%, from 138 days last year to 49 days this year. This faster sale time suggests an increase in market activity or improved efficiency in the sales process.
12 Months to Date
- Units Listed: Over the past 12 months, there’s been an 11.11% decrease in units listed, from 162 to 144. This could indicate a slight tightening in the market with fewer new listings available.
- Units Reported Sold: Contrasting the decrease in listings, there’s an 11.76% increase in units reported sold, from 68 to 76, suggesting that despite fewer listings, demand remains strong or has increased.
- Reported Sales Dollars: The total sales dollars have increased by 7.14%, indicating that, overall, the market value has risen even with fluctuations in individual sale prices.
- Average Sell Price / Unit: There’s a slight decrease of 4.14% in the average sell price over the last 12 months, which could reflect a variance in the types of properties sold or market adjustments.
Year to Date
The year-to-date figures mirror the current month’s activity, as January is the first month of the year.
Market Implications
This analysis demonstrates a stable demand for residential single-family homes in Lake Cowichan, with a notable decrease in average selling prices that may make this area more attractive to buyers seeking affordability. The significant reduction in days to sell indicates a more dynamic market, potentially benefiting sellers with faster transactions. However, the slight tightening in inventory (reflected in the 12-month listing decrease) could pressure prices in the future if demand continues to outpace supply.
Active listings at the end of January stand at 23, slightly below last year’s 25, hinting at a somewhat tighter market but still offering options for prospective buyers.
Overall, Lake Cowichan’s real estate market is showing signs of increased efficiency and a potential shift towards more affordable housing options. Buyers and sellers should monitor these trends closely, as the balance between supply and demand will continue to influence market dynamics in the coming months.


Comments are closed