
In March 2024, the real estate market in Campbell River experienced notable shifts. The data from the Vancouver Island Real Estate Board reveals trends and changes that are essential for buyers, sellers, and investors to understand. I aim to dissect these trends thoroughly, providing an insightful analysis of how the market is evolving.
Economic Conditions:
The economic landscape in Canada currently features a stable policy rate of 5% by the Bank of Canada, amid varying economic indicators. With inflation at a lower rate of 2.8% as of February, down from previous months, and a slight increase in unemployment to 6.1%, the economic conditions are mixed. The softening job market and warnings from major banks about potential recessions reflect a cautious environment. For the real estate market, these conditions suggest that interest rates might soon decrease, affecting mortgage rates and, ultimately, housing demand in Campbell River.
Supply and Demand:
March 2024 saw a reduction in listings and sales for Campbell River homes, with a significant shift in average selling prices. The data shows a decrease in units listed by 34.38% compared to last year, with sold units also down by 45.45%. However, the average sell price per unit has increased by 12.99% from the previous year, indicating a market that, despite fewer transactions, sees higher value per transaction.
Campbell River Real Estate Market Overview for March 2024:
This March, the real estate market in Campbell River showed signs of tightening, with fewer listings and sales compared to last year but increased average selling prices. The overall health of the market appears resilient, with economic factors such as stable interest rates and a slight uptick in unemployment influencing buyer and seller behaviors. Key factors this month include a reduced number of active listings and slower sales activity, which may be beginning to impact prices and market dynamics.
Detailed Analysis:
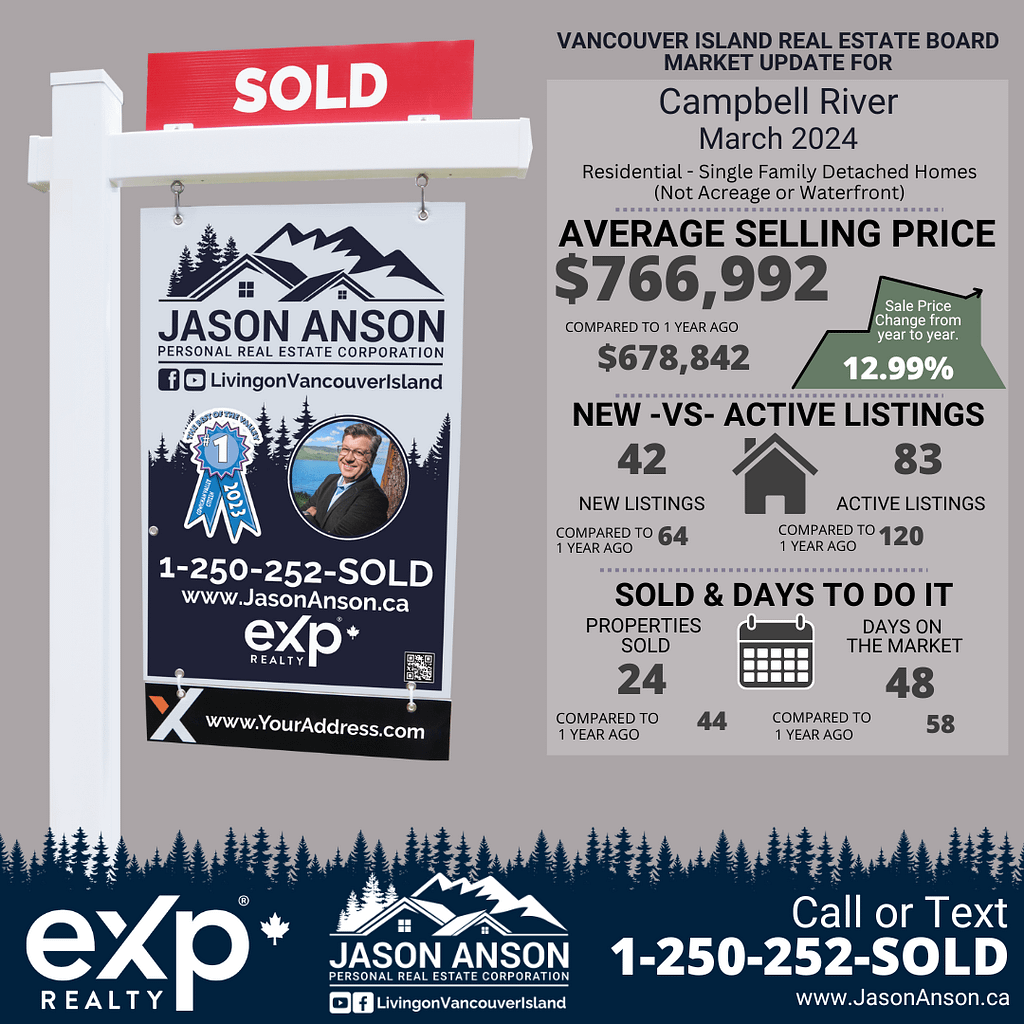
In March 2024, Campbell River’s real estate market displayed a distinct trend towards higher selling prices despite a drop in listings and sales volumes. This year, the units listed decreased by 34.38% to 42 from last year’s 64 in the same month, reflecting a tighter market with fewer options for buyers. Meanwhile, units reported sold also decreased sharply by 45.45%, totaling 24 compared to 44 last year. Despite these lower volumes, the average selling price increased, suggesting that the properties on the market may be of higher value or that buyers are willing to pay more in a constrained market.
Campbell River Real Estate Market Insight: Comparative Activity by Residential – Single Family Detached for March 2024:
The comparative activity in March 2024 for residential single-family detached homes in Campbell River highlights several critical metrics. Units listed experienced a significant drop of 34.38% year-over-year. Similarly, units reported sold saw a decrease of 45.45% from the previous year. The sell/list ratio also reflected a more challenging market with a decrease from 68.75% last year to 57.14% this year. The reported sales dollars fell by 38.37% to $18,407,800, reflecting the lower volume of transactions. However, the average sell price per unit rose by 12.99% to $766,992, indicating that the value of homes sold is on the rise despite fewer sales. The median sell price also increased from $692,500 last year to $782,000, underscoring the upward pressure on home values in this segment. Days to sell improved, dropping from 58 days last year to 48 days, showing a slightly faster-moving market.
Current Month Analysis:
- Units Listed: 42 homes were listed this month, marking a 34.38% decrease from last year, indicating fewer homeowners are putting their houses on the market.
- Units Reported Sold: There were 24 sales, a sharp 45.45% decrease from last year, reflecting slower market activity.
- Sell/List Ratio: The ratio decreased to 57.14% from last year’s 68.75%, suggesting a tougher market for sellers.
- Reported Sales Dollars: Sales volume decreased significantly to $18,407,800, down 38.37% from last year.
- Average Sell Price/Unit: Despite fewer sales, the average price per unit sold rose significantly by 12.99% to $766,992, indicating higher property values.
- Median Sell Price: Increased to $782,000 from $692,500 last year, further confirming the rise in home values.
- Sell Price/List Price Ratio: Slightly decreased to 96.38% from last year’s 97.93%, showing a small shift in pricing dynamics.
- Days to Sell: Homes are selling faster, with the number of days on the market decreasing from 58 last year to 48 this month.
- Active Listings: Only 83 homes were actively listed, down from 120 last year, pointing to a significant tightening of available inventory.
- Listings and Sales Volume: The drop in both listings and sales volume reflects a contracting market.
- Pricing Trends: Both average and median prices have increased, indicating a market with rising property values despite fewer transactions.
- Market Efficiency: With homes selling faster and for a higher percentage of their listing price, the market efficiency appears to be improving slightly.
12 Months to Date Analysis:
- Units Listed: Over the past 12 months, Campbell River saw a 21.63% decrease in listings, from 712 last year to 558 this year, indicating a contracting market supply.
- Units Reported Sold: Sales increased slightly by 12.71% to 408 from 362 last year, showing a resilient demand despite fewer listings.
- Sell/List Ratio: The sell/list ratio over the past 12 months averaged 73.12%, compared to last year’s 50.84%, indicating an improving efficiency in the market.
- Reported Sales Dollars: Total sales dollars over the last 12 months increased to $292,777,657, up 12.08% from $261,224,746, highlighting a higher overall market value.
- Average Sell Price/Unit: The average sell price per unit slightly decreased by 0.56% to $717,592, suggesting price stabilization.
- Median Sell Price: Stood at $720,000, reflecting the central trend of the market values.
- Sell Price/List Price Ratio: The ratio slightly decreased to 98.60% from last year’s 98.08%, showing a minimal shift in market dynamics.
- Days to Sell: Increased to 50 from 45 last year, indicating a slight slowdown in market activity.
- Active Listings: The number of active listings has decreased significantly, highlighting a tighter market environment.
- Listings and Sales Volume: The volume of listings and sales has shown mixed signals with fewer listings but more sales, indicating a shift in market dynamics.
- Pricing Trends: Slight fluctuations in average sell prices over the year show a market in transition.
- Market Efficiency: The overall market efficiency is improving, as evidenced by a better sell/list ratio and stable pricing.
Year to Date Analysis:
- Units Listed: Year to date, there’s been a 31.93% decrease in listings, showing a significant tightening in the market.
- Units Reported Sold: Sales decreased by 31.46%, aligning with the fewer listings and indicating a proportional drop in transactions.
- Sell/List Ratio: Stabilized around 53.61%, slightly down from last year.
- Reported Sales Dollars: Saw a decrease to $44,595,475, down 26.92% from $61,026,273, reflecting the lower sales volume.
- Average Sell Price/Unit: Increased by 6.62% to $731,073, suggesting that properties available are fetching higher prices.
- Median Sell Price: Showed an upward trend, which aligns with the increase in average sell price.
- Sell Price/List Price Ratio: Held steady, indicating that homes are selling close to their asking prices.
- Days to Sell: Shortened to 53 days from 60, indicating a slightly quicker sales process despite fewer listings.
- Active Listings: Continued to decline, stressing the scarcity in available properties.
- Listings and Sales Volume: The decrease in both listings and sales volume underscores a constrained market environment.
- Pricing Trends: The increase in average and median sell prices highlights a market where values are climbing despite lower inventory.
- Market Efficiency: The decrease in days to sell and steady sell/list ratio indicate an efficient market under current conditions.
Impact on Buyers:
- Emerging Trends and Market Adjustments: The average sell price per unit’s increase is an important indicator of market adjustments, potentially increasing buyer negotiation power.
- In-depth Analysis of Emerging Trends: The current sell/list ratios and pricing trends are crucial for understanding buyer behavior in Campbell River.
- Buyer Behavior Insights: Recent market data suggests that buyers might be facing higher prices but could benefit from a quicker sales process.
- Current Market Status: With fewer active listings and higher prices, the market is becoming more competitive for buyers.
- Is Now a Good Time to Buy?: Considering the increasing prices and tightening inventory, buyers should weigh their options carefully, potentially acting quickly to secure properties before prices climb further.
- Potential Impact of Future Interest Rate Changes: With potential changes in interest rates, buyers need to stay informed about how this could affect mortgage rates and overall affordability.
- Sale Times Analysis: The quicker sale times could indicate a seller’s market, meaning buyers might have less time to deliberate on purchases.
Impact on Sellers:
- In-depth Analysis of Emerging Trends: Sellers in Campbell River are currently benefiting from higher average sell prices and a competitive market that favors well-priced listings.
- Seller Behavior Insights: Sellers might be encouraged by current trends to list their properties, expecting good returns due to high demand and lower supply.
- Current Market Status for Sellers: The market conditions are favorable for sellers, with high prices and quick sale times.
- Is Now a Good Time to Sell?: Given the market dynamics, it is a favorable time for sellers to enter the market, especially if they can command higher prices.
- Impact of Potential Interest Rate Changes: Upcoming interest rate changes could influence the timing of decisions for potential sellers, as shifts could affect buyer affordability.
- Analysis of Sale Times: The current fast sale times provide an advantageous environment for sellers, suggesting that properties may sell quickly at desirable prices.
Market Sentiment:
In summary, Campbell River’s real estate market in March 2024 has shown resilience with an increase in average sell prices despite a reduction in listings and sales volumes. These conditions suggest a seller’s market with competitive pricing and quick sales. For buyers, the market conditions necessitate swift decision-making and potential compromises on price points. For sellers, the current trends indicate a good time to list properties to capitalize on high demand. This comprehensive analysis should aid market participants in making informed decisions whether looking to buy, sell, or invest in Campbell River.
🔍 Seeking market insights? Discover how trends can benefit you!
🏠 Thinking of Buying or Selling?
📲 Call or Text: 1-250-252-SOLD
For Expert Advice, visit https://jasonanson.ca/book-a-call/.


Comments are closed