
In February 2024, Shawnigan Lake experienced notable fluctuations in the real estate market, particularly in residential single-family detached homes (excluding acreage and waterfront properties). This report delves into the intricacies of these changes, providing a detailed analysis of listings, sales volume, pricing trends, market efficiency, and overall market health. With a marked decrease in listings and a dramatic increase in sales activity, Shawnigan Lake’s market dynamics offer valuable insights for potential buyers and sellers.
Market Overview of February 2024:
The Shawnigan Lake real estate market has shown considerable volatility this month. A striking 100% decrease in units listed compared to the previous year underscores a tightening market with limited options for buyers. Conversely, units reported sold have doubled, indicating a significant uptick in demand. These metrics suggest a robust seller’s market, with a noticeable shift towards higher sales prices and a quicker turnover rate.
Comparative Activity by Property Type for February 2024:
- Units Listed: A stark decline in listings, from 1 to 0 month-over-month, and a 14.29% decrease year-to-date, suggests a constricted market environment.
- Units Reported Sold: Sales tripled from the previous year, with a year-to-date increase of 13.64%, reflecting heightened buyer activity.
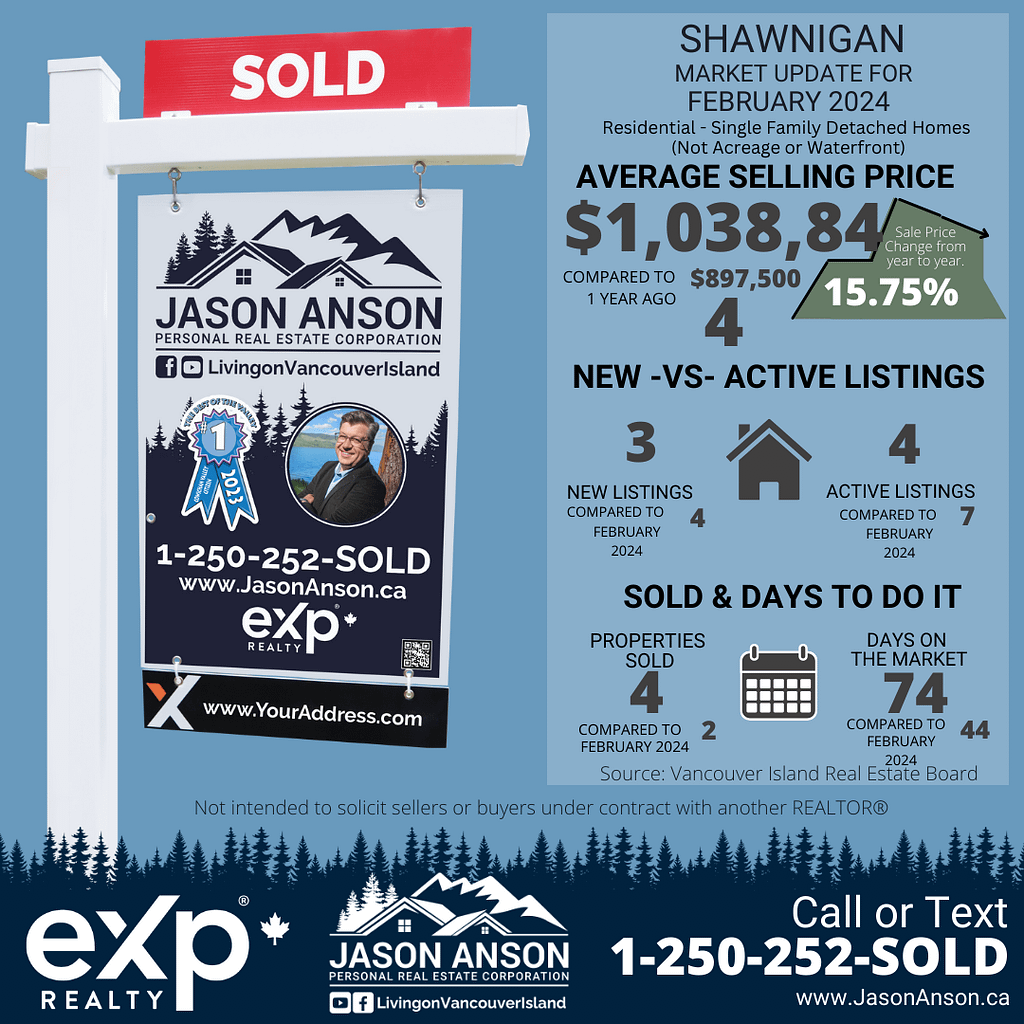
- Reported Sales Dollars: Witnessed a substantial increase to $3,370,375 for the current month, showcasing a market with high-value transactions.
- Average Sell Price/Unit: The average selling price saw a 19.52% increase, affirming the market’s upward price trend.
- Sell Price/List Price Ratio: Improved to 97.05%, indicating sellers are achieving near-list prices.
- Days to Sell: Increased significantly to 91 days, suggesting a longer selling period despite the high demand.
Current Month Analysis:
The Shawnigan Lake market in February 2024 demonstrated a notable imbalance between supply and demand, marked by a complete absence of new listings and a tripling of sales compared to the previous year. This scenario has pushed average selling prices upwards, with the sell/list ratio achieving 100%, a clear indicator of a strong seller’s market.
Impact on Buyers and Sellers:
Buyers face a challenging market in Shawnigan Lake, with scarce inventory pushing prices upward. Sellers, on the other hand, find themselves in a favorable position, able to command higher prices and expect quick sales, despite the longer days on market.
Regional Highlights:
The Cowichan Valley region, particularly Shawnigan Lake, is experiencing a significant shift towards a seller’s market. This dynamic is characterized by increased sales activity and elevated selling prices, indicative of strong buyer interest and limited inventory.
Active Listings:
With only 4 active listings in February 2024, down from 7 in the previous year, the inventory in Shawnigan Lake remains tight. This scarcity is a key driver behind the competitive market conditions and escalating property values.
Market Insights:
The current trends in Shawnigan Lake highlight a market adjusting to increased demand and limited supply. The significant increase in reported sales dollars and the high average sell price/unit emphasize the market’s robustness and the potential for continued price growth.
Listings and Sales Volume:
February 2024’s dramatic reduction in listings, coupled with a surge in sales, reflects a market that is rapidly absorbing available inventory. This dynamic is likely to persist, maintaining upward pressure on prices.
Pricing Trends:
The upward trajectory of selling prices, evidenced by the average sell price/unit, points to a market where buyers are willing to pay premium prices for available properties. This trend underscores the strong demand in Shawnigan Lake.
Market Efficiency:
The increase in days to sell indicates a market where, despite fewer listings and higher demand, properties are taking longer to sell. This could reflect a discrepancy between seller expectations and market realities.
Conclusion:
The Shawnigan Lake real estate market in February 2024 presents a complex landscape for buyers and sellers. With a sharp decrease in listings and a significant increase in sales activity, prices are on the rise, and market conditions favor sellers. Buyers must navigate this competitive market carefully, while sellers can capitalize on the strong demand. As the market continues to evolve, engaging with a knowledgeable real estate professional is more crucial than ever.
🔍 Seeking market insights? Discover how trends can benefit you!
🏠 Thinking of Buying or Selling? Explore your options.
📲 Call or Text: 1-250-252-SOLD
For Expert Advice, visit Jason Anson Real Estate.


Comments are closed