

Vancouver Island Real Estate Market
The numbers behind the market, updated as they move.Vancouver Island real estate market data sits across several different views, and this page brings them together. Each one answers a different question. Read them alongside each other and you learn far more than any single figure will tell you on its own.

- Monthly reports carry the numbers. Home values are published month by month and archived here.
- 30 day movement shows the near term. Listings, average sold price and days on market for the last month.
- 12 months to date shows the trend. The same measures across a year, which is where direction becomes visible.
- The MLS activity feed is live. Recent sold listings rather than a monthly summary.
- Affordable and expensive are separated. Island wide averages hide a very wide spread between communities.
- Every region has its own market page. Island wide numbers are a starting point, not an answer.
Vancouver Island Real Estate Market Overview
Vancouver Island is not one market. It is more than 300 of them. A waterfront home in Oak Bay and a lot in Port Alberni are both Vancouver Island real estate. The prices have nothing in common.
So go easy on any one number that is meant to cover all 300. What is true everywhere is that people want in. Buyers come from other parts of the Island, from the mainland, and from outside the province. Most towns do not have many homes for sale. In the small ones, three or four sales can swing the average.
Treat the Island number as a starting point, not an answer. Every region below runs its own market, and each has its own report.
Subscribe to the Market Update
Under each set of statistics is a Subscribe to the Market Update button. Set it once and the report comes to you instantly, daily, weekly or monthly, whichever suits. The frequency can be changed or cancelled at any time.
Vancouver Island: 30 Day Market Movement
(SEP 22, 2026 - OCT 22, 2026)
Vancouver Island: 30 Day Market Movement

How To Read the 30 Day Numbers
- What it shows. How many homes sold in the last month, what they sold for, and how long they took. Each one shows whether it went up or down.
- Why it matters. This is the closest thing to right now. If sales are up and homes are selling faster, buyers are moving. If sales drop but the average price jumps, it usually means a few bigger homes sold, not that your home is worth more.
- Ask yourself. How long would it take to sell my home if I listed it this month?
The Island figure above is an average of all seven regions below. Pick the one you actually care about and the numbers get a great deal more useful.
Vancouver Island: 12 Months to Date

How To Read the 12 Month Trend
- What it shows. The same numbers across a full year, month by month.
- Why it matters. One month can jump around. A full year does not. It also shows you the seasons. Spring and early summer are busy here and winter is slow, so comparing March to November tells you about the calendar rather than the market.
- Ask yourself. Are we up or down right now, and when is the better time to list?
Vancouver Island MLS Activity Feed


How To Read the Activity Feed
- What it shows. Sold, active and pending listings as they update. Sold tells you what buyers actually paid. Active tells you what a seller is competing against. Pending tells you what is getting offers right now.
- Why it matters. An asking price is a guess. A sold price is real money that changed hands, which makes it the most reliable measure of value there is. Pending activity is the earliest signal of where buyers are moving next, and it shows up here before it shows up in any monthly figure.
- Ask yourself. What did homes like mine really sell for, what else is on the market, and which price ranges are moving?
Questions About These Numbers
Yes. Use the Subscribe to the Market Update button under any set of statistics, then set the frequency. Instantly, daily, weekly or monthly, and it can be changed or cancelled at any time.
The 12 month one, nearly always. A single month can jump around on a handful of odd sales, especially in a small town. A full year smooths that out.
This page covers all 300 plus towns at once, so it is a starting point and not much more. Each region has its own market page under this one, and each town under that. The further down you go, the more the number is worth.
An asking price is a guess. A sold price is real money that changed hands. The sold feed is the only part of this page that shows what buyers actually paid.
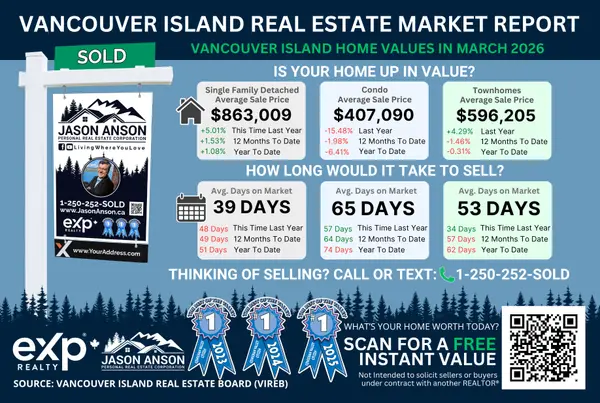
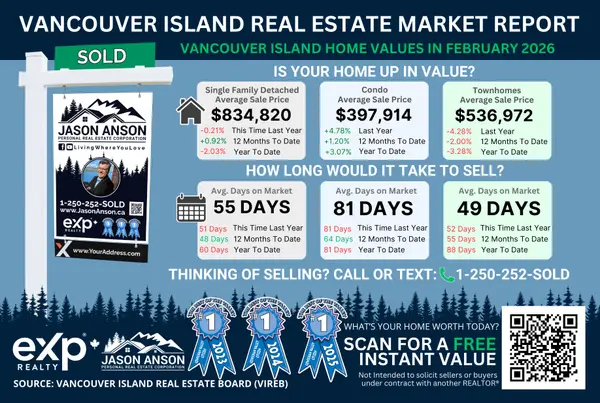
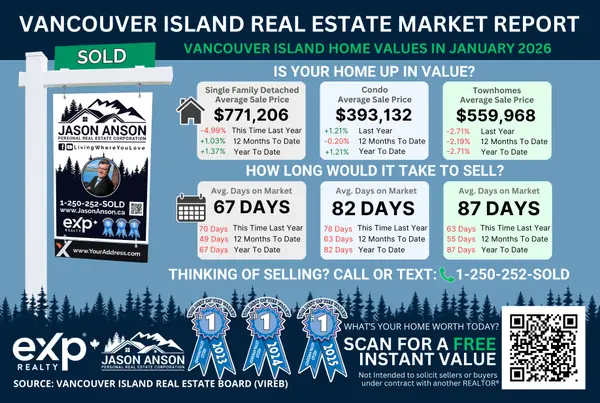
Vancouver Island Real Estate Market Reports
Top 5 Reasons to Invest in the Vancouver Island Real Estate Market
- Lifestyle driven demand and steady in migration for the climate, coastline and quality of life.
- Constrained coastal land supply, which limits how quickly new inventory can arrive in most communities.
- Diversified local economy across government, health care, education, tourism, trades and forestry.
- Strong relative value against mainland markets while retaining Island amenities.
- Healthy rental fundamentals in the university, hospital and government centres.
Most Affordable Communities on Vancouver Island



Browse the most affordable homes for sale across Vancouver Island. Updated daily with MLS listings sorted from low to high price.
View Affordable ListingsMost Expensive Communities on Vancouver Island



Explore premium and luxury properties across Vancouver Island. Updated daily with MLS listings sorted from high to low price.
View Expensive ListingsNo graph on this page can tell you that. What can is what homes like yours have just sold for, an honest look at the shape yours is in, and the things only your own street knows. I don't guess your home's value. I prove it using actual market value and real market movement so you can protect your equity and move forward with confidence.

Let's Connect and Talk
Good News If You Are Buying
When the seasons turn, more homes come up and sellers get more willing to talk. Houses and townhomes in Nanaimo, the Cowichan Valley and the Comox Valley keep coming to market at a steady pace, and that gives buyers room to move.
Watch for homes that have dropped their price, places under 500,000 dollars, waterfront and acreage, and open houses. Each of those is worth watching if the timing suits you.
Search MLS listings by price, property type and location. From affordable starter homes to waterfront estates, acreages and family neighbourhoods, find the right fit for your lifestyle and budget.
Get expert guidance on selling, buying and protecting your equity. Access home valuations, market insights and trusted support for your next move across Vancouver Island communities.
From the North Island wilderness to the charm of the Gulf Islands, each region offers unique communities, housing options and lifestyle experiences. Discover which area best fits your family, your retirement plans or your career goals.