The Top Most Expensive Communities on Vancouver Island for August 2025
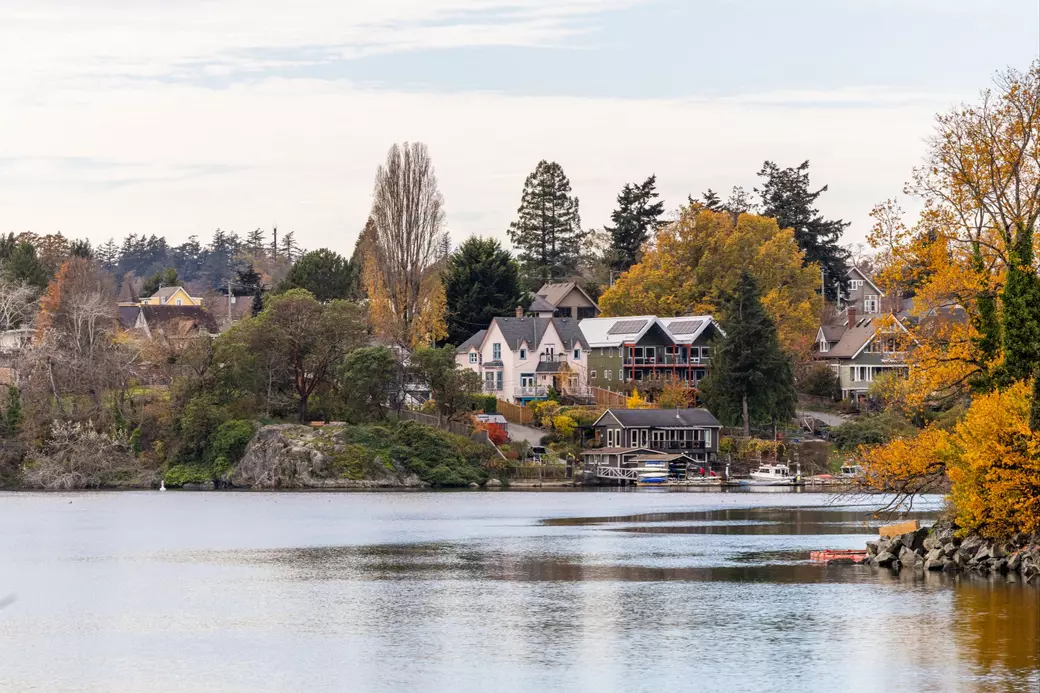
The Top Most Expensive Communities on Vancouver Island for August 2025 brings together single family detached results, not acreage and not waterfront, from across the Island. Below is a ranked table based on the twelve months to date average price. Use it to see where values are highest, how prices have moved over the past year, and how year to date trends compare by community.
Top Most Expensive Communities on Vancouver Island – August 2025
Fairwinds leads Vancouver Island for August 2025 with an average just under one point four million dollars. Tofino takes the second position with pricing above one point one million dollars, and Mill Bay remains the top Cowichan Valley community. The north end of Nanaimo is a clear premium cluster, with North Nanaimo and Hammond Bay both a little over one million dollars, followed by Nanoose and North Jingle Pot.
Among strong movers, Pleasant Valley posted a twenty three percent annual gain, and Ucluelet rose almost twenty three percent year over year. Saltair and Cowichan Station and Glenora also showed double digit annual increases. On the value side, Campbellton, Gold River, and Port Alice recorded the lowest averages on the twelve month view, while Port Hardy and Kelsey Bay and Sayward moved higher year to date as activity broadened in the North Island.
Results are based on the twelve months to date average sell price per unit for single family detached homes that are not acreage and not waterfront. Year over year change compares the rolling twelve month average with the same window last year. Year to date change compares the average for the year so far with the same period last year. Communities with no qualifying sales show N/A for one or more fields.
Categories
- All Blogs (78)
- BC Property Tax Search (10)
- Cost of Living on Vancouver Island (2)
- Living on Vancouver Island (26)
- Most Affordable Communities in Campbell River (1)
- Most Affordable Communities in Nanaimo (1)
- Most Affordable Communities in Parksville and Qualicum (1)
- Most Affordable Communities in the Comox Valley (1)
- Most Affordable Communities in the Cowichan Valley (1)
- Most Affordable Communities in the North Island (1)
- Most Affordable Communities in the Surrounding Islands (1)
- Most Affordable Communities on Vancouver Island (1)
- Most Expensive Communities in Campbell River (1)
- Most Expensive Communities in Nanaimo (1)
- Most Expensive Communities in Parksville and Qualicum (1)
- Most Expensive Communities in the Comox Valley (1)
- Most Expensive Communities in the Cowichan Valley (1)
- Most Expensive Communities in the North Island (1)
- Most Expensive Communities in the Port Alberni Area (2)
- Most Expensive Communities in the Surrounding Islands (1)
- Most Expensive Communities on Vancouver Island (1)
- People’s Choice Awards (10)
- Real Estate Market Guide (6)
- Vancouver Island Real Estate Market Reports (3)
- Youbou Real Estate Market Reports (3)
Recent Posts




Thinking About Selling or Buying?
Market conditions change quickly and what looks like a sellers’ market today may balance out in the months ahead. If you are planning to sell your home or purchase a property, having the right data and strategy at the right time is key.
I provide custom Market Movement reports and strategy sessions so you understand exactly where your property stands before making your next move. Connect with me below to get started.

