

test 6
Vancouver Island (Board Area) Real Estate Market Report: August 2025
Single Family Detached (Not Acreage or Waterfront)
| Metric | Current Month | 12 Months to Date | Year to Date | ||||||
|---|---|---|---|---|---|---|---|---|---|
| This Year | Last Year | % Change | This Year | Last Year | % Change | This Year | Last Year | % Change | |
| Units Listed | 513 | 596 | -13.93% | 6,613 | 6,696 | -1.24% | 5,016 | 5,084 | -1.34% |
| Units Reported Sold | 339 | 330 | 2.73% | 3,905 | 3,395 | 15.02% | 2,757 | 2,510 | 9.84% |
| Sell / List Ratio | 66.08% | 55.37% | 19.34% | 59.05% | 50.70% | 16.47% | 54.96% | 49.37% | 11.32% |
| Reported Sales Dollars | $279,076,827 | $266,452,893 | 4.74% | $3,226,836,072 | $2,765,169,864 | 16.70% | $2,295,600,031 | $2,055,514,245 | 11.68% |
| Average Sell Price / Unit | $823,235 | $807,433 | 1.96% | $826,334 | $814,483 | 1.46% | $832,644 | $818,930 | 1.67% |
| Median Sell Price | $790,000 | $793,000 | — | $800,000 | — | — | — | — | — |
| Sell Price / List Price | 97.61% | 97.67% | -0.06% | 97.88% | 97.83% | 0.05% | 98.08% | 98.01% | 0.07% |
| Days to Sell | 50 | 54 | -7.41% | 50 | 45 | 11.11% | 47 | 44 | 6.82% |
| Active Listings | 1,424 | 1,564 | — | — | — | — | — | — | — |
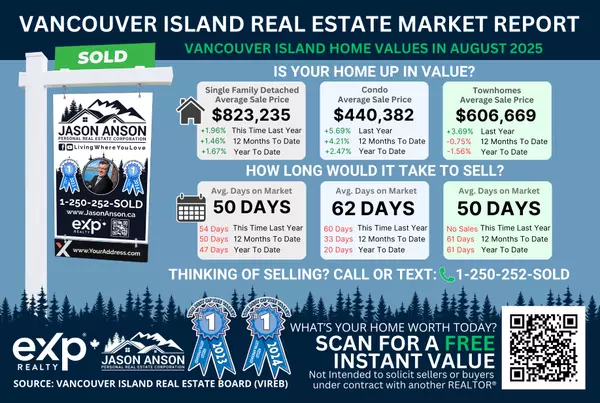
Did my single family detached home (not acreage or waterfront) value go up in Vancouver Island (Board Area) in August 2025? Yes: the average sell price rose to $823,235, 1.96% year over year.
How many days will it take to sell my single family detached home (not acreage or waterfront) in Vancouver Island (Board Area)? Typical time to sell was about 50 days.
Source: Vancouver Island Real Estate Board — August 2025. SAR = Sales ÷ Active Listings. MOI = Active ÷ Sales (∞ if no sales). Current-month readings reflect August 2025 for the Board Area.
Single Family Detached (Acreage)
| Metric | Current Month | 12 Months to Date | Year to Date | ||||||
|---|---|---|---|---|---|---|---|---|---|
| This Year | Last Year | % Change | This Year | Last Year | % Change | This Year | Last Year | % Change | |
| Units Listed | 105 | 111 | -5.41% | 1,331 | 1,359 | -2.06% | 1,008 | 1,039 | -2.98% |
| Units Reported Sold | 64 | 44 | 45.45% | 582 | 496 | 17.34% | 424 | 359 | 18.11% |
| Sell / List Ratio | 60.95% | 39.64% | 53.76% | 43.73% | 36.50% | 19.81% | 42.06% | 34.55% | 21.74% |
| Reported Sales Dollars | $75,782,751 | $49,367,344 | 53.51% | $729,719,193 | $593,561,738 | 22.94% | $537,488,551 | $426,249,588 | 26.10% |
| Average Sell Price / Unit | $1,184,105 | $1,121,985 | 5.54% | $1,253,813 | $1,196,697 | 4.77% | $1,267,662 | $1,187,325 | 6.77% |
| Median Sell Price | $985,000 | $1,119,950 | — | $1,148,950 | — | — | — | — | — |
| Sell Price / List Price | 95.85% | 95.86% | -0.01% | 95.26% | 95.97% | -0.74% | 95.37% | 96.10% | -0.76% |
| Days to Sell | 70 | 67 | 4.48% | 75 | 71 | 5.63% | 68 | 67 | 1.49% |
| Active Listings | 467 | 478 | — | — | — | — | — | — | — |
Did my single family acreage home value go up in Vancouver Island (Board Area) in August 2025? Yes: the average sell price rose to $1,184,105, 5.54% year over year.
How many days will it take to sell my single family acreage home in Vancouver Island (Board Area)? Typical time to sell was about 70 days.
Source: Vancouver Island Real Estate Board — August 2025. SAR = Sales ÷ Active Listings. MOI = Active ÷ Sales (∞ if no sales). Current-month readings reflect August 2025 for the Board Area.
Single Family Detached (Waterfront)
| Metric | Current Month | 12 Months to Date | Year to Date | ||||||
|---|---|---|---|---|---|---|---|---|---|
| This Year | Last Year | % Change | This Year | Last Year | % Change | This Year | Last Year | % Change | |
| Units Listed | 48 | 58 | -17.24% | 692 | 720 | -3.89% | 529 | 579 | -8.64% |
| Units Reported Sold | 34 | 35 | -2.86% | 293 | 240 | 22.08% | 208 | 180 | 15.56% |
| Sell / List Ratio | 70.83% | 60.34% | 17.38% | 42.34% | 33.33% | 27.03% | 39.32% | 31.09% | 26.47% |
| Reported Sales Dollars | $44,062,750 | $43,028,344 | 2.40% | $417,699,471 | $364,527,693 | 14.59% | $294,486,961 | $272,401,893 | 8.11% |
| Average Sell Price / Unit | $1,295,963 | $1,229,381 | 5.42% | $1,425,595 | $1,518,865 | -6.14% | $1,415,803 | $1,513,344 | -6.45% |
| Median Sell Price | $1,050,000 | $1,250,000 | — | $1,250,000 | — | — | — | — | — |
| Sell Price / List Price | 95.55% | 95.77% | -0.23% | 95.19% | 96.16% | -1.01% | 95.32% | 96.48% | -1.20% |
| Days to Sell | 69 | 62 | 11.29% | 73 | 70 | 4.29% | 70 | 66 | 6.06% |
| Active Listings | 275 | 290 | — | — | — | — | — | — | — |
Did my single family waterfront home value go up in Vancouver Island (Board Area) in August 2025? Yes: the average sell price rose to $1,295,963, 5.42% year over year.
How many days will it take to sell my single family waterfront home in Vancouver Island (Board Area)? Typical time to sell was about 69 days.
Source: Vancouver Island Real Estate Board — August 2025. SAR = Sales ÷ Active Listings. MOI = Active ÷ Sales (∞ if no sales). Current-month readings reflect August 2025 for the Board Area.
Single Family Detached (Combined)
| Metric | Current Month | 12 Months to Date | Year to Date | ||||||
|---|---|---|---|---|---|---|---|---|---|
| This Year | Last Year | % Change | This Year | Last Year | % Change | This Year | Last Year | % Change | |
| Units Listed | 647 | 743 | -12.92% | 8,365 | 8,506 | -1.66% | 6,344 | 6,483 | -2.14% |
| Units Reported Sold | 423 | 397 | 6.55% | 4,678 | 4,054 | 15.39% | 3,319 | 2,996 | 10.78% |
| Sell / List Ratio | 65.38% | 53.43% | 22.37% | 55.92% | 47.66% | 17.33% | 52.32% | 46.21% | 13.22% |
| Reported Sales Dollars | $378,401,828 | $344,982,137 | 9.69% | $4,218,468,476 | $3,604,420,801 | 17.04% | $3,021,606,543 | $2,681,744,732 | 12.67% |
| Average Sell Price / Unit | $894,567 | $868,973 | 2.95% | $901,768 | $889,102 | 1.42% | $910,397 | $895,108 | 1.71% |
| Median Sell Price | $819,000 | $825,000 | — | $829,750 | — | — | — | — | — |
| Sell Price / List Price | 97.22% | 97.28% | -0.06% | 97.31% | 97.42% | -0.11% | 97.50% | 97.59% | -0.09% |
| Days to Sell | 53 | 55 | -3.64% | 53 | 49 | 8.16% | 50 | 47 | 6.38% |
| Active Listings | 2,042 | 2,208 | — | — | — | — | — | — | — |
Did my single family detached home (combined) value go up in Vancouver Island (Board Area) in August 2025? Yes: the average sell price rose to $894,567, 2.95% year over year.
How many days will it take to sell my single family detached home (combined) in Vancouver Island (Board Area)? Typical time to sell was about 53 days.
Source: Vancouver Island Real Estate Board — August 2025. SAR = Sales ÷ Active Listings. MOI = Active ÷ Sales (∞ if no sales). Current-month readings reflect August 2025 for the Board Area.
Condo Apartment
| Metric | Current Month | 12 Months to Date | Year to Date | ||||||
|---|---|---|---|---|---|---|---|---|---|
| This Year | Last Year | % Change | This Year | Last Year | % Change | This Year | Last Year | % Change | |
| Units Listed | 104 | 115 | -9.57% | 1,559 | 1,674 | -6.87% | 1,169 | 1,256 | -6.93% |
| Units Reported Sold | 74 | 68 | 8.82% | 834 | 823 | 1.34% | 580 | 592 | -2.03% |
| Sell / List Ratio | 71.15% | 59.13% | 20.33% | 53.50% | 49.16% | 8.83% | 49.62% | 47.13% | 5.28% |
| Reported Sales Dollars | $32,588,300 | $28,333,625 | 15.02% | $364,466,833 | $345,113,349 | 5.61% | $252,996,545 | $252,007,916 | 0.39% |
| Average Sell Price / Unit | $440,382 | $416,671 | 5.69% | $437,011 | $419,336 | 4.21% | $436,201 | $425,689 | 2.47% |
| Median Sell Price | $427,000 | $410,000 | — | $408,000 | — | — | — | — | — |
| Sell Price / List Price | 97.34% | 97.34% | 0.00% | 97.86% | 97.98% | -0.12% | 98.02% | 97.98% | 0.04% |
| Days to Sell | 62 | 60 | 3.33% | 33 | 50 | -34.00% | 20 | 51 | -60.78% |
| Active Listings | 396 | 437 | — | — | — | — | — | — | — |
Did my condo apartment value go up in Vancouver Island (Board Area) in August 2025? Yes: the average sell price rose to $440,382, 5.69% year over year.
How many days will it take to sell my condo apartment in Vancouver Island (Board Area)? Typical time to sell was about 62 days.
Source: Vancouver Island Real Estate Board — August 2025. SAR = Sales ÷ Active Listings. MOI = Active ÷ Sales (∞ if no sales). Current-month readings reflect August 2025 for the Board Area.
Row/Townhouse
| Metric | Current Month | 12 Months to Date | Year to Date | ||||||
|---|---|---|---|---|---|---|---|---|---|
| This Year | Last Year | % Change | This Year | Last Year | % Change | This Year | Last Year | % Change | |
| Units Listed | 124 | 145 | -14.48% | 1,480 | 1,619 | -8.59% | 1,132 | 1,205 | -6.06% |
| Units Reported Sold | 72 | 69 | 4.35% | 915 | 842 | 8.67% | 609 | 626 | -2.72% |
| Sell / List Ratio | 58.06% | 47.59% | 22.00% | 61.82% | 52.01% | 18.86% | 53.80% | 51.95% | 3.56% |
| Reported Sales Dollars | $43,680,150 | $40,371,400 | 8.20% | $532,381,787 | $493,613,789 | 7.85% | $349,966,841 | $365,437,864 | -4.23% |
| Average Sell Price / Unit | $606,669 | $585,093 | 3.69% | $581,838 | $586,240 | -0.75% | $574,658 | $583,767 | -1.56% |
| Median Sell Price | $597,500 | $573,000 | — | $565,000 | — | — | — | — | — |
| Sell Price / List Price | 97.81% | 98.25% | -0.45% | 98.40% | 98.56% | -0.16% | 98.42% | 98.43% | -0.01% |
| Days to Sell | 51 | 51 | 0.00% | 54 | 51 | 5.88% | 49 | 52 | -5.77% |
| Active Listings | 355 | 364 | — | — | — | — | — | — | — |
Did my row/townhouse value go up in Vancouver Island (Board Area) in August 2025? Yes: the average sell price rose to $606,669, 3.69% year over year.
How many days will it take to sell my row/townhouse in Vancouver Island (Board Area)? Typical time to sell was about 51 days.
Source: Vancouver Island Real Estate Board — August 2025. SAR = Sales ÷ Active Listings. MOI = Active ÷ Sales (∞ if no sales). Current-month readings reflect August 2025 for the Board Area.
Half Duplex
| Metric | Current Month | 12 Months to Date | Year to Date | ||||||
|---|---|---|---|---|---|---|---|---|---|
| This Year | Last Year | % Change | This Year | Last Year | % Change | This Year | Last Year | % Change | |
| Units Listed | 35 | 27 | 29.63% | 338 | 318 | 6.29% | 263 | 230 | 14.35% |
| Units Reported Sold | 16 | 19 | -15.79% | 198 | 193 | 2.59% | 144 | 140 | 2.86% |
| Sell / List Ratio | 45.71% | 70.37% | -35.04% | 58.58% | 60.69% | -3.48% | 54.75% | 60.87% | -10.05% |
| Reported Sales Dollars | $9,021,255 | $11,545,375 | -21.86% | $124,287,839 | $117,277,459 | 5.98% | $91,011,781 | $85,099,045 | 6.95% |
| Average Sell Price / Unit | $563,828 | $607,651 | -7.21% | $627,716 | $607,655 | 3.30% | $632,026 | $607,850 | 3.98% |
| Median Sell Price | $589,500 | $620,000 | — | $620,278 | — | — | — | — | — |
| Sell Price / List Price | 98.28% | 98.68% | -0.41% | 98.52% | 98.44% | 0.08% | 98.60% | 98.79% | -0.19% |
| Days to Sell | 41 | 57 | -28.07% | 55 | 46 | 19.57% | 54 | 46 | 17.39% |
| Active Listings | 99 | 56 | — | — | — | — | — | — | — |
Did my half duplex value go up in Vancouver Island (Board Area) in August 2025? No: the average sell price fell to $563,828, -7.21% year over year.
How many days will it take to sell my half duplex in Vancouver Island (Board Area)? Typical time to sell was about 41 days.
Source: Vancouver Island Real Estate Board — August 2025. SAR = Sales ÷ Active Listings. MOI = Active ÷ Sales (∞ if no sales). Current-month readings reflect August 2025 for the Board Area.
Full Duplex
| Metric | Current Month | 12 Months to Date | Year to Date | ||||||
|---|---|---|---|---|---|---|---|---|---|
| This Year | Last Year | % Change | This Year | Last Year | % Change | This Year | Last Year | % Change | |
| Units Listed | 7 | 4 | 75.00% | 59 | 80 | -26.25% | 43 | 60 | -28.33% |
| Units Reported Sold | 3 | 3 | 0.00% | 27 | 24 | 12.50% | 22 | 17 | 29.41% |
| Sell / List Ratio | 42.86% | 75.00% | -42.85% | 45.76% | 30.00% | 52.53% | 51.16% | 28.33% | 80.59% |
| Reported Sales Dollars | $1,704,900 | $2,105,000 | -19.01% | $19,218,900 | $18,817,800 | 2.13% | $15,793,400 | $12,817,000 | 23.22% |
| Average Sell Price / Unit | $568,300 | $701,667 | -19.01% | $711,811 | $784,075 | -9.22% | $717,882 | $753,941 | -4.78% |
| Median Sell Price | $649,900 | $750,000 | — | $710,000 | — | — | — | — | — |
| Sell Price / List Price | 96.66% | 99.30% | -2.66% | 96.16% | 96.94% | -0.80% | 96.31% | 97.47% | -1.19% |
| Days to Sell | 81 | 41 | 97.56% | 72 | 40 | 80.00% | 69 | 43 | 60.47% |
| Active Listings | 15 | 29 | — | — | — | — | — | — | — |
Did my full duplex value go up in Vancouver Island (Board Area) in August 2025? No: the average sell price fell to $568,300, -19.01% year over year.
How many days will it take to sell my full duplex in Vancouver Island (Board Area)? Typical time to sell was about 81 days.
Source: Vancouver Island Real Estate Board — August 2025. SAR = Sales ÷ Active Listings. MOI = Active ÷ Sales (∞ if no sales). Current-month readings reflect August 2025 for the Board Area.
Triplex
| Metric | Current Month | 12 Months to Date | Year to Date | ||||||
|---|---|---|---|---|---|---|---|---|---|
| This Year | Last Year | % Change | This Year | Last Year | % Change | This Year | Last Year | % Change | |
| Units Listed | 0 | 1 | -100.00% | 9 | 6 | 50.00% | 7 | 4 | 75.00% |
| Units Reported Sold | 0 | 0 | — | 3 | 1 | 200.00% | 1 | 1 | 0.00% |
| Sell / List Ratio | 0.00% | — | — | 33.33% | 16.67% | 99.94% | 14.29% | 25.00% | -42.84% |
| Reported Sales Dollars | $0 | $0 | — | $2,235,000 | $1,350,000 | 65.56% | $725,000 | $1,350,000 | -46.30% |
| Average Sell Price / Unit | $745,000 | $1,350,000 | -44.81% | $725,000 | $1,350,000 | -46.30% | — | — | — |
| Median Sell Price | $725,000 | — | — | $725,000 | — | — | — | — | — |
| Sell Price / List Price | 95.39% | — | — | 96.44% | 90.74% | 6.28% | 96.44% | — | — |
| Days to Sell | 36 | — | — | 56 | — | — | 21 | — | — |
| Active Listings | 0 | 3 | — | — | — | — | — | — | — |
Did my triplex value go up in Vancouver Island (Board Area) in August 2025? No: the average sell price fell to $745,000, -44.81% year over year.
How many days will it take to sell my triplex in Vancouver Island (Board Area)? Typical time to sell was about 36 days.
Source: Vancouver Island Real Estate Board — August 2025. SAR = Sales ÷ Active Listings. MOI = Active ÷ Sales (∞ if no sales). Current-month readings reflect August 2025 for the Board Area.
Quadruplex
| Metric | Current Month | 12 Months to Date | Year to Date | ||||||
|---|---|---|---|---|---|---|---|---|---|
| This Year | Last Year | % Change | This Year | Last Year | % Change | This Year | Last Year | % Change | |
| Units Listed | 2 | 3 | -33.33% | 15 | 12 | 25.00% | 12 | 9 | 33.33% |
| Units Reported Sold | 1 | 0 | — | 7 | 3 | 133.33% | 4 | 3 | 33.33% |
| Sell / List Ratio | 50.00% | 0.00% | — | 46.67% | 25.00% | 86.68% | 33.33% | 33.33% | 0.00% |
| Reported Sales Dollars | $1,750,000 | $0 | — | $7,430,000 | $2,681,000 | 177.14% | $4,690,000 | $2,681,000 | 74.93% |
| Average Sell Price / Unit | $1,750,000 | — | — | $1,061,429 | $893,667 | 18.77% | $1,172,500 | $893,667 | 31.20% |
| Median Sell Price | $1,750,000 | — | — | $1,075,000 | — | — | $1,112,500 | — | — |
| Sell Price / List Price | 94.09% | — | — | 89.88% | 101.18% | -11.17% | 87.57% | 101.18% | -13.45% |
| Days to Sell | 100 | — | — | 76 | 85 | -10.59% | 105 | 85 | 23.53% |
| Active Listings | 6 | 5 | — | — | — | — | — | — | — |
Did my quadruplex value go up in Vancouver Island (Board Area) in August 2025? No change: the average sell price changed to $1,750,000, — year over year.
How many days will it take to sell my quadruplex in Vancouver Island (Board Area)? Typical time to sell was about 100 days.
Source: Vancouver Island Real Estate Board — August 2025. SAR = Sales ÷ Active Listings. MOI = Active ÷ Sales (∞ if no sales). Current-month readings reflect August 2025 for the Board Area.
Manufactured Home
| Metric | Current Month | 12 Months to Date | Year to Date | ||||||
|---|---|---|---|---|---|---|---|---|---|
| This Year | Last Year | % Change | This Year | Last Year | % Change | This Year | Last Year | % Change | |
| Units Listed | 62 | 73 | -15.07% | 732 | 776 | -5.67% | 539 | 565 | -4.60% |
| Units Reported Sold | 45 | 46 | -2.17% | 441 | 420 | 5.00% | 302 | 303 | -0.33% |
| Sell / List Ratio | 72.58% | 63.01% | 15.19% | 60.25% | 54.12% | 11.33% | 56.03% | 53.63% | 4.48% |
| Reported Sales Dollars | $12,558,650 | $16,447,250 | -23.64% | $147,803,025 | $140,048,921 | 5.54% | $98,424,188 | $104,916,332 | -6.19% |
| Average Sell Price / Unit | $279,081 | $357,549 | -21.95% | $335,154 | $333,450 | 0.51% | $325,908 | $346,259 | -5.88% |
| Median Sell Price | $256,000 | $300,000 | — | $291,000 | — | — | — | — | — |
| Sell Price / List Price | 95.42% | 95.48% | -0.06% | 95.73% | 95.79% | -0.06% | 95.92% | 95.93% | -0.01% |
| Days to Sell | 72 | 62 | 16.13% | 71 | 53 | 33.96% | 72 | 56 | 28.57% |
| Active Listings | 196 | 194 | — | — | — | — | — | — | — |
Did my manufactured home value go up in Vancouver Island (Board Area) in August 2025? No: the average sell price fell to $279,081, -21.95% year over year.
How many days will it take to sell my manufactured home in Vancouver Island (Board Area)? Typical time to sell was about 72 days.
Source: Vancouver Island Real Estate Board — August 2025. SAR = Sales ÷ Active Listings. MOI = Active ÷ Sales (∞ if no sales). Current-month readings reflect August 2025 for the Board Area.
Recreational
| Metric | Current Month | 12 Months to Date | Year to Date | ||||||
|---|---|---|---|---|---|---|---|---|---|
| This Year | Last Year | % Change | This Year | Last Year | % Change | This Year | Last Year | % Change | |
| Units Listed | 10 | 6 | 66.67% | 107 | 74 | 44.59% | 86 | 61 | 40.98% |
| Units Reported Sold | 4 | 3 | 33.33% | 37 | 23 | 60.87% | 30 | 17 | 76.47% |
| Sell / List Ratio | 40.00% | 50.00% | -20.00% | 34.58% | 31.08% | 11.26% | 34.88% | 27.87% | 25.15% |
| Reported Sales Dollars | $1,253,000 | $753,000 | 66.40% | $18,646,899 | $8,924,550 | 108.94% | $15,486,900 | $7,160,550 | 116.28% |
| Average Sell Price / Unit | $313,250 | $251,000 | 24.80% | $503,970 | $388,024 | 29.88% | $516,230 | $421,209 | 22.56% |
| Median Sell Price | $278,000 | $315,000 | — | $310,000 | — | — | — | — | — |
| Sell Price / List Price | 89.58% | 95.09% | -5.79% | 92.40% | 89.90% | 2.78% | 92.93% | 89.06% | 4.35% |
| Days to Sell | 57 | 96 | -40.62% | 96 | 101 | -4.95% | 95 | 103 | -7.77% |
| Active Listings | 44 | 33 | — | — | — | — | — | — | — |
Did my recreational property value go up in Vancouver Island (Board Area) in August 2025? Yes: the average sell price rose to $313,250, 24.80% year over year.
How many days will it take to sell my recreational property in Vancouver Island (Board Area)? Typical time to sell was about 57 days.
Source: Vancouver Island Real Estate Board — August 2025. SAR = Sales ÷ Active Listings. MOI = Active ÷ Sales (∞ if no sales). Current-month readings reflect August 2025 for the Board Area.
Land
| Metric | Current Month | 12 Months to Date | Year to Date | ||||||
|---|---|---|---|---|---|---|---|---|---|
| This Year | Last Year | % Change | This Year | Last Year | % Change | This Year | Last Year | % Change | |
| Units Listed | 91 | 104 | -12.50% | 1,219 | 1,288 | -5.36% | 899 | 946 | -4.97% |
| Units Reported Sold | 26 | 28 | -7.14% | 342 | 316 | 8.23% | 226 | 233 | -3.00% |
| Sell / List Ratio | 28.57% | 26.92% | 6.13% | 28.06% | 24.53% | 14.39% | 25.14% | 24.63% | 2.07% |
| Reported Sales Dollars | $16,183,500 | $13,111,700 | 23.43% | $157,992,506 | $146,225,465 | 8.05% | $107,256,181 | $103,733,040 | 3.40% |
| Average Sell Price / Unit | $622,442 | $468,275 | 32.92% | $461,966 | $462,739 | -0.17% | $474,585 | $445,206 | 6.60% |
| Median Sell Price | $402,500 | $380,000 | — | $370,000 | — | — | — | — | — |
| Sell Price / List Price | 94.82% | 94.07% | 0.80% | 93.48% | 93.90% | -0.45% | 93.32% | 95.18% | -1.95% |
| Days to Sell | 133 | 132 | 0.76% | 112 | 112 | 0.00% | 108 | 118 | -8.47% |
| Active Listings | 664 | 645 | — | — | — | — | — | — | — |
Did my land value go up in Vancouver Island (Board Area) in August 2025? Yes: the average sell price rose to $622,442, 32.92% year over year.
How many days will it take to sell my land in Vancouver Island (Board Area)? Typical time to sell was about 133 days.
Source: Vancouver Island Real Estate Board — August 2025. SAR = Sales ÷ Active Listings. MOI = Active ÷ Sales (∞ if no sales). Current-month readings reflect August 2025 for the Board Area.
Other
| Metric | Current Month | 12 Months to Date | Year to Date | ||||||
|---|---|---|---|---|---|---|---|---|---|
| This Year | Last Year | % Change | This Year | Last Year | % Change | This Year | Last Year | % Change | |
| Units Listed | 5 | 2 | 150.00% | 29 | 21 | 38.10% | 24 | 15 | 60.00% |
| Units Reported Sold | 0 | 0 | — | 4 | 6 | -33.33% | 3 | 4 | -25.00% |
| Sell / List Ratio | 0.00% | 0.00% | — | 13.79% | 28.57% | -51.73% | 12.50% | 26.67% | -53.13% |
| Reported Sales Dollars | $0 | $0 | — | $1,955,000 | $3,776,999 | -48.24% | $1,855,000 | $2,934,999 | -36.80% |
| Average Sell Price / Unit | $488,750 | — | -22.36% | $618,333 | $733,750 | -15.73% | — | — | — |
| Median Sell Price | $297,500 | — | — | $310,000 | — | — | — | — | — |
| Sell Price / List Price | 92.83% | — | — | 89.34% | 94.79% | -5.75% | 89.24% | — | — |
| Days to Sell | 119 | — | 26.60% | 94 | — | 33.00% | 133 | — | — |
| Active Listings | 18 | 6 | — | — | — | — | — | — | — |
Did my other residential property value go up in Vancouver Island (Board Area) in August 2025? No: the average sell price fell to $488,750, -22.36% year over year.
How many days will it take to sell my other residential property in Vancouver Island (Board Area)? Typical time to sell was about 119 days.
Source: Vancouver Island Real Estate Board — August 2025. SAR = Sales ÷ Active Listings. MOI = Active ÷ Sales (∞ if no sales). Current-month readings reflect August 2025 for the Board Area.
Source: Vancouver Island Real Estate Board. Data reflect August 2025 Board Area figures.
Categories


Thinking About Selling or Buying?
Market conditions change quickly and what looks like a sellers’ market today may balance out in the months ahead. If you are planning to sell your home or purchase a property, having the right data and strategy at the right time is key.
I provide custom Market Movement reports and strategy sessions so you understand exactly where your property stands before making your next move. Connect with me below to get started.

Explore Vancouver Island Regions
From the North Island wilderness to the charm of the Gulf Islands, each region offers unique communities, housing options, and lifestyle experiences. Discover which area best fits your family, retirement plans, or career goals.