

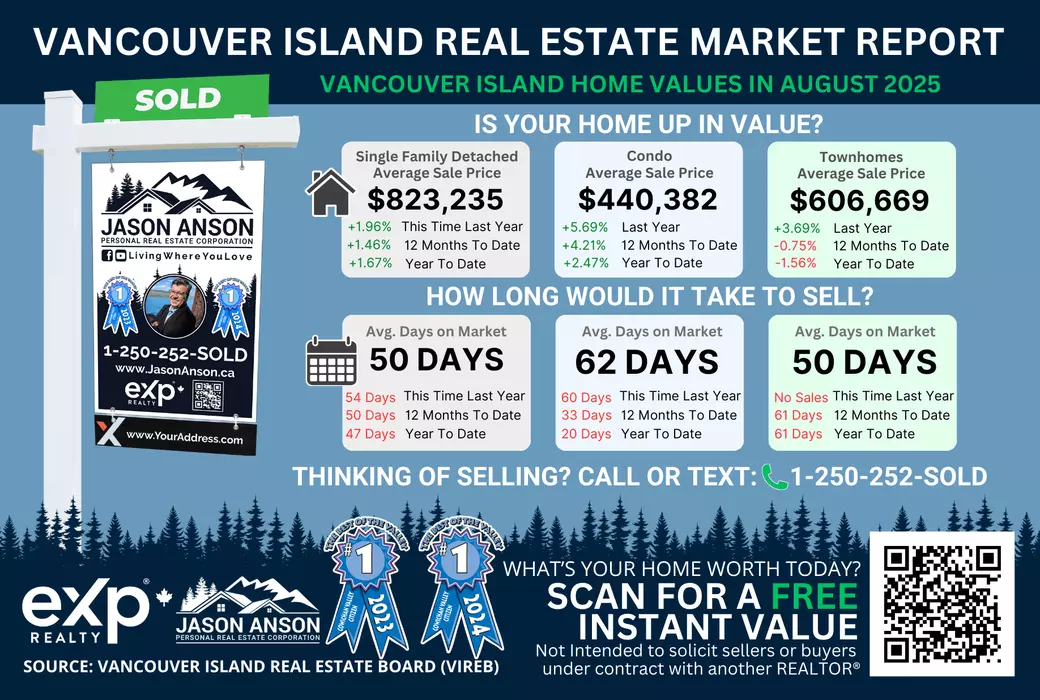
Vancouver Island Home Values in August 2025
Vancouver Island Home Values in August 2025 give buyers and sellers an important look at how the market is shifting across the region. Each month, local sales and listings data reveal whether conditions are leaning toward sellers, balancing out, or offering more opportunities for buyers. This report highlights the key movements you need to know before making your next move.
Is Vancouver Island in a Buyers’, Sellers’ or Balanced Market?
Find out now in the table below. The Vancouver Island real estate market balance is determined using two main indicators. Sales-to-Active Ratio (SAR) is the percentage of active listings that sell in a month on Vancouver Island, excluding the Greater Victoria area. Months of Inventory (MOI) is the number of months it would take to sell all current listings at the present sales pace.
Sellers’ Market: Homes are selling quickly and sellers have more leverage. Interpreted as SAR ≥ 20% (about one in five or more listings sells) or MOI ≤ 4 (four months of supply or less).
Balanced Market: Supply and demand are roughly even. Interpreted as SAR 12–19% (about one in eight to one in five listings sells) or MOI about 5–6 months of supply.
Buyers’ Market: Buyers have more choice and stronger negotiating power. Interpreted as SAR ≤ 11% (about one in nine or fewer listings sells) or MOI ≥ 7 months of supply. If no sales occur in a category, MOI shows as ∞ (infinite).
When a badge shows an arrow (→), that segment is leaning toward the next category because it sits near a threshold.
| Property Type | Sales | Active | SAR | MOI | Market Type |
|---|---|---|---|---|---|
| Single Family — Not Acreage/Waterfront | 339 | 1,424 | 23.8% | 4.2 | Sellers’ Market |
| Single Family — Acreage | 64 | 467 | 13.7% | 7.3 | Balanced → Buyers’ Market |
| Single Family — Waterfront | 34 | 275 | 12.4% | 8.1 | Balanced → Buyers’ Market |
| Single Family — Combined | 423 | 2,042 | 20.7% | 4.8 | Sellers’ Market |
| Condo Apartment | 74 | 396 | 18.7% | 5.4 | Balanced Market |
| Row/Townhouse | 72 | 355 | 20.3% | 4.9 | Sellers’ Market |
| Half Duplex | 16 | 99 | 16.2% | 6.2 | Balanced Market |
| Full Duplex | 3 | 15 | 20.0% | 5.0 | Balanced → Sellers’ Market |
| Triplex | 0 | 0 | 0.0% | ∞ | Buyers’ Market (no sales) |
| Quadruplex | 1 | 6 | 16.7% | 6.0 | Balanced Market |
| Manufactured Home | 45 | 196 | 23.0% | 4.4 | Sellers’ Market |
| Recreational | 4 | 44 | 9.1% | 11.0 | Buyers’ Market |
| Land | 26 | 664 | 3.9% | 25.5 | Buyers’ Market |
| Other | 0 | 18 | 0.0% | ∞ | Buyers’ Market (no sales) |
| Notes: SAR means Sales divided by Active listings. MOI means Active listings divided by the month’s sales. The symbol ∞ appears when there were no sales in that category for the month. Figures shown are the current-month results for August 2025 and come from the Vancouver Island Real Estate Board (VIREB). | |||||
Market Insights: Vancouver Island in August 2025
Each month brings a different picture of supply and demand across Vancouver Island. Detached homes, acreages, and waterfront properties often move in different directions, while condos and townhomes provide distinct entry points for first-time buyers.
Vancouver Island (Board Area) Real Estate Market Report: August 2025
Single Family Detached (Not Acreage or Waterfront)
| Metric | Current Month | 12 Months to Date | Year to Date | ||||||
|---|---|---|---|---|---|---|---|---|---|
| This Year | Last Year | % Change | This Year | Last Year | % Change | This Year | Last Year | % Change | |
| Units Listed | 513 | 596 | -13.93% | 6,613 | 6,696 | -1.24% | 5,016 | 5,084 | -1.34% |
| Units Reported Sold | 339 | 330 | 2.73% | 3,905 | 3,395 | 15.02% | 2,757 | 2,510 | 9.84% |
| Sell / List Ratio | 66.08% | 55.37% | 19.34% | 59.05% | 50.70% | 16.47% | 54.96% | 49.37% | 11.32% |
| Reported Sales Dollars | $279,076,827 | $266,452,893 | 4.74% | $3,226,836,072 | $2,765,169,864 | 16.70% | $2,295,600,031 | $2,055,514,245 | 11.68% |
| Average Sell Price / Unit | $823,235 | $807,433 | 1.96% | $826,334 | $814,483 | 1.46% | $832,644 | $818,930 | 1.67% |
| Median Sell Price | $790,000 | $793,000 | — | $800,000 | — | — | — | — | — |
| Sell Price / List Price | 97.61% | 97.67% | -0.06% | 97.88% | 97.83% | 0.05% | 98.08% | 98.01% | 0.07% |
| Days to Sell | 50 | 54 | -7.41% | 50 | 45 | 11.11% | 47 | 44 | 6.82% |
| Active Listings | 1,424 | 1,564 | — | — | — | — | — | — | — |
Did my single family detached home (not acreage or waterfront) value go up in Vancouver Island (Board Area) in August 2025? Yes: the average sell price rose to $823,235, 1.96% year over year.
How many days will it take to sell my single family detached home (not acreage or waterfront) in Vancouver Island (Board Area)? Typical time to sell was about 50 days.
Source: Vancouver Island Real Estate Board — August 2025. SAR = Sales ÷ Active Listings. MOI = Active ÷ Sales (∞ if no sales). Current-month readings reflect August 2025 for the Board Area.
Single Family Detached (Acreage)
| Metric | Current Month | 12 Months to Date | Year to Date | ||||||
|---|---|---|---|---|---|---|---|---|---|
| This Year | Last Year | % Change | This Year | Last Year | % Change | This Year | Last Year | % Change | |
| Units Listed | 105 | 111 | -5.41% | 1,331 | 1,359 | -2.06% | 1,008 | 1,039 | -2.98% |
| Units Reported Sold | 64 | 44 | 45.45% | 582 | 496 | 17.34% | 424 | 359 | 18.11% |
| Sell / List Ratio | 60.95% | 39.64% | 53.76% | 43.73% | 36.50% | 19.81% | 42.06% | 34.55% | 21.74% |
| Reported Sales Dollars | $75,782,751 | $49,367,344 | 53.51% | $729,719,193 | $593,561,738 | 22.94% | $537,488,551 | $426,249,588 | 26.10% |
| Average Sell Price / Unit | $1,184,105 | $1,121,985 | 5.54% | $1,253,813 | $1,196,697 | 4.77% | $1,267,662 | $1,187,325 | 6.77% |
| Median Sell Price | $985,000 | $1,119,950 | — | $1,148,950 | — | — | — | — | — |
| Sell Price / List Price | 95.85% | 95.86% | -0.01% | 95.26% | 95.97% | -0.74% | 95.37% | 96.10% | -0.76% |
| Days to Sell | 70 | 67 | 4.48% | 75 | 71 | 5.63% | 68 | 67 | 1.49% |
| Active Listings | 467 | 478 | — | — | — | — | — | — | — |
Did my single family acreage home value go up in Vancouver Island (Board Area) in August 2025? Yes: the average sell price rose to $1,184,105, 5.54% year over year.
How many days will it take to sell my single family acreage home in Vancouver Island (Board Area)? Typical time to sell was about 70 days.
Source: Vancouver Island Real Estate Board — August 2025. SAR = Sales ÷ Active Listings. MOI = Active ÷ Sales (∞ if no sales). Current-month readings reflect August 2025 for the Board Area.
Single Family Detached (Waterfront)
| Metric | Current Month | 12 Months to Date | Year to Date | ||||||
|---|---|---|---|---|---|---|---|---|---|
| This Year | Last Year | % Change | This Year | Last Year | % Change | This Year | Last Year | % Change | |
| Units Listed | 48 | 58 | -17.24% | 692 | 720 | -3.89% | 529 | 579 | -8.64% |
| Units Reported Sold | 34 | 35 | -2.86% | 293 | 240 | 22.08% | 208 | 180 | 15.56% |
| Sell / List Ratio | 70.83% | 60.34% | 17.38% | 42.34% | 33.33% | 27.03% | 39.32% | 31.09% | 26.47% |
| Reported Sales Dollars | $44,062,750 | $43,028,344 | 2.40% | $417,699,471 | $364,527,693 | 14.59% | $294,486,961 | $272,401,893 | 8.11% |
| Average Sell Price / Unit | $1,295,963 | $1,229,381 | 5.42% | $1,425,595 | $1,518,865 | -6.14% | $1,415,803 | $1,513,344 | -6.45% |
| Median Sell Price | $1,050,000 | $1,250,000 | — | $1,250,000 | — | — | — | — | — |
| Sell Price / List Price | 95.55% | 95.77% | -0.23% | 95.19% | 96.16% | -1.01% | 95.32% | 96.48% | -1.20% |
| Days to Sell | 69 | 62 | 11.29% | 73 | 70 | 4.29% | 70 | 66 | 6.06% |
| Active Listings | 275 | 290 | — | — | — | — | — | — | — |
Did my single family waterfront home value go up in Vancouver Island (Board Area) in August 2025? Yes: the average sell price rose to $1,295,963, 5.42% year over year.
How many days will it take to sell my single family waterfront home in Vancouver Island (Board Area)? Typical time to sell was about 69 days.
Source: Vancouver Island Real Estate Board — August 2025. SAR = Sales ÷ Active Listings. MOI = Active ÷ Sales (∞ if no sales). Current-month readings reflect August 2025 for the Board Area.
Single Family Detached (Combined)
| Metric | Current Month | 12 Months to Date | Year to Date | ||||||
|---|---|---|---|---|---|---|---|---|---|
| This Year | Last Year | % Change | This Year | Last Year | % Change | This Year | Last Year | % Change | |
| Units Listed | 647 | 743 | -12.92% | 8,365 | 8,506 | -1.66% | 6,344 | 6,483 | -2.14% |
| Units Reported Sold | 423 | 397 | 6.55% | 4,678 | 4,054 | 15.39% | 3,319 | 2,996 | 10.78% |
| Sell / List Ratio | 65.38% | 53.43% | 22.37% | 55.92% | 47.66% | 17.33% | 52.32% | 46.21% | 13.22% |
| Reported Sales Dollars | $378,401,828 | $344,982,137 | 9.69% | $4,218,468,476 | $3,604,420,801 | 17.04% | $3,021,606,543 | $2,681,744,732 | 12.67% |
| Average Sell Price / Unit | $894,567 | $868,973 | 2.95% | $901,768 | $889,102 | 1.42% | $910,397 | $895,108 | 1.71% |
| Median Sell Price | $819,000 | $825,000 | — | $829,750 | — | — | — | — | — |
| Sell Price / List Price | 97.22% | 97.28% | -0.06% | 97.31% | 97.42% | -0.11% | 97.50% | 97.59% | -0.09% |
| Days to Sell | 53 | 55 | -3.64% | 53 | 49 | 8.16% | 50 | 47 | 6.38% |
| Active Listings | 2,042 | 2,208 | — | — | — | — | — | — | — |
Did my single family detached home (combined) value go up in Vancouver Island (Board Area) in August 2025? Yes: the average sell price rose to $894,567, 2.95% year over year.
How many days will it take to sell my single family detached home (combined) in Vancouver Island (Board Area)? Typical time to sell was about 53 days.
Source: Vancouver Island Real Estate Board — August 2025. SAR = Sales ÷ Active Listings. MOI = Active ÷ Sales (∞ if no sales). Current-month readings reflect August 2025 for the Board Area.
Condo Apartment
| Metric | Current Month | 12 Months to Date | Year to Date | ||||||
|---|---|---|---|---|---|---|---|---|---|
| This Year | Last Year | % Change | This Year | Last Year | % Change | This Year | Last Year | % Change | |
| Units Listed | 104 | 115 | -9.57% | 1,559 | 1,674 | -6.87% | 1,169 | 1,256 | -6.93% |
| Units Reported Sold | 74 | 68 | 8.82% | 834 | 823 | 1.34% | 580 | 592 | -2.03% |
| Sell / List Ratio | 71.15% | 59.13% | 20.33% | 53.50% | 49.16% | 8.83% | 49.62% | 47.13% | 5.28% |
| Reported Sales Dollars | $32,588,300 | $28,333,625 | 15.02% | $364,466,833 | $345,113,349 | 5.61% | $252,996,545 | $252,007,916 | 0.39% |
| Average Sell Price / Unit | $440,382 | $416,671 | 5.69% | $437,011 | $419,336 | 4.21% | $436,201 | $425,689 | 2.47% |
| Median Sell Price | $427,000 | $410,000 | — | $408,000 | — | — | — | — | — |
| Sell Price / List Price | 97.34% | 97.34% | 0.00% | 97.86% | 97.98% | -0.12% | 98.02% | 97.98% | 0.04% |
| Days to Sell | 62 | 60 | 3.33% | 33 | 50 | -34.00% | 20 | 51 | -60.78% |
| Active Listings | 396 | 437 | — | — | — | — | — | — | — |
Did my condo apartment value go up in Vancouver Island (Board Area) in August 2025? Yes: the average sell price rose to $440,382, 5.69% year over year.
How many days will it take to sell my condo apartment in Vancouver Island (Board Area)? Typical time to sell was about 62 days.
Source: Vancouver Island Real Estate Board — August 2025. SAR = Sales ÷ Active Listings. MOI = Active ÷ Sales (∞ if no sales). Current-month readings reflect August 2025 for the Board Area.
Row/Townhouse
| Metric | Current Month | 12 Months to Date | Year to Date | ||||||
|---|---|---|---|---|---|---|---|---|---|
| This Year | Last Year | % Change | This Year | Last Year | % Change | This Year | Last Year | % Change | |
| Units Listed | 124 | 145 | -14.48% | 1,480 | 1,619 | -8.59% | 1,132 | 1,205 | -6.06% |
| Units Reported Sold | 72 | 69 | 4.35% | 915 | 842 | 8.67% | 609 | 626 | -2.72% |
| Sell / List Ratio | 58.06% | 47.59% | 22.00% | 61.82% | 52.01% | 18.86% | 53.80% | 51.95% | 3.56% |
| Reported Sales Dollars | $43,680,150 | $40,371,400 | 8.20% | $532,381,787 | $493,613,789 | 7.85% | $349,966,841 | $365,437,864 | -4.23% |
| Average Sell Price / Unit | $606,669 | $585,093 | 3.69% | $581,838 | $586,240 | -0.75% | $574,658 | $583,767 | -1.56% |
| Median Sell Price | $597,500 | $573,000 | — | $565,000 | — | — | — | — | — |
| Sell Price / List Price | 97.81% | 98.25% | -0.45% | 98.40% | 98.56% | -0.16% | 98.42% | 98.43% | -0.01% |
| Days to Sell | 51 | 51 | 0.00% | 54 | 51 | 5.88% | 49 | 52 | -5.77% |
| Active Listings | 355 | 364 | — | — | — | — | — | — | — |
Did my row/townhouse value go up in Vancouver Island (Board Area) in August 2025? Yes: the average sell price rose to $606,669, 3.69% year over year.
How many days will it take to sell my row/townhouse in Vancouver Island (Board Area)? Typical time to sell was about 51 days.
Source: Vancouver Island Real Estate Board — August 2025. SAR = Sales ÷ Active Listings. MOI = Active ÷ Sales (∞ if no sales). Current-month readings reflect August 2025 for the Board Area.
Half Duplex
| Metric | Current Month | 12 Months to Date | Year to Date | ||||||
|---|---|---|---|---|---|---|---|---|---|
| This Year | Last Year | % Change | This Year | Last Year | % Change | This Year | Last Year | % Change | |
| Units Listed | 35 | 27 | 29.63% | 338 | 318 | 6.29% | 263 | 230 | 14.35% |
| Units Reported Sold | 16 | 19 | -15.79% | 198 | 193 | 2.59% | 144 | 140 | 2.86% |
| Sell / List Ratio | 45.71% | 70.37% | -35.04% | 58.58% | 60.69% | -3.48% | 54.75% | 60.87% | -10.05% |
| Reported Sales Dollars | $9,021,255 | $11,545,375 | -21.86% | $124,287,839 | $117,277,459 | 5.98% | $91,011,781 | $85,099,045 | 6.95% |
| Average Sell Price / Unit | $563,828 | $607,651 | -7.21% | $627,716 | $607,655 | 3.30% | $632,026 | $607,850 | 3.98% |
| Median Sell Price | $589,500 | $620,000 | — | $620,278 | — | — | — | — | — |
| Sell Price / List Price | 98.28% | 98.68% | -0.41% | 98.52% | 98.44% | 0.08% | 98.60% | 98.79% | -0.19% |
| Days to Sell | 41 | 57 | -28.07% | 55 | 46 | 19.57% | 54 | 46 | 17.39% |
| Active Listings | 99 | 56 | — | — | — | — | — | — | — |
Did my half duplex value go up in Vancouver Island (Board Area) in August 2025? No: the average sell price fell to $563,828, -7.21% year over year.
How many days will it take to sell my half duplex in Vancouver Island (Board Area)? Typical time to sell was about 41 days.
Source: Vancouver Island Real Estate Board — August 2025. SAR = Sales ÷ Active Listings. MOI = Active ÷ Sales (∞ if no sales). Current-month readings reflect August 2025 for the Board Area.
Full Duplex
| Metric | Current Month | 12 Months to Date | Year to Date | ||||||
|---|---|---|---|---|---|---|---|---|---|
| This Year | Last Year | % Change | This Year | Last Year | % Change | This Year | Last Year | % Change | |
| Units Listed | 7 | 4 | 75.00% | 59 | 80 | -26.25% | 43 | 60 | -28.33% |
| Units Reported Sold | 3 | 3 | 0.00% | 27 | 24 | 12.50% | 22 | 17 | 29.41% |
| Sell / List Ratio | 42.86% | 75.00% | -42.85% | 45.76% | 30.00% | 52.53% | 51.16% | 28.33% | 80.59% |
| Reported Sales Dollars | $1,704,900 | $2,105,000 | -19.01% | $19,218,900 | $18,817,800 | 2.13% | $15,793,400 | $12,817,000 | 23.22% |
| Average Sell Price / Unit | $568,300 | $701,667 | -19.01% | $711,811 | $784,075 | -9.22% | $717,882 | $753,941 | -4.78% |
| Median Sell Price | $649,900 | $750,000 | — | $710,000 | — | — | — | — | — |
| Sell Price / List Price | 96.66% | 99.30% | -2.66% | 96.16% | 96.94% | -0.80% | 96.31% | 97.47% | -1.19% |
| Days to Sell | 81 | 41 | 97.56% | 72 | 40 | 80.00% | 69 | 43 | 60.47% |
| Active Listings | 15 | 29 | — | — | — | — | — | — | — |
Did my full duplex value go up in Vancouver Island (Board Area) in August 2025? No: the average sell price fell to $568,300, -19.01% year over year.
How many days will it take to sell my full duplex in Vancouver Island (Board Area)? Typical time to sell was about 81 days.
Source: Vancouver Island Real Estate Board — August 2025. SAR = Sales ÷ Active Listings. MOI = Active ÷ Sales (∞ if no sales). Current-month readings reflect August 2025 for the Board Area.
Triplex
| Metric | Current Month | 12 Months to Date | Year to Date | ||||||
|---|---|---|---|---|---|---|---|---|---|
| This Year | Last Year | % Change | This Year | Last Year | % Change | This Year | Last Year | % Change | |
| Units Listed | 0 | 1 | -100.00% | 9 | 6 | 50.00% | 7 | 4 | 75.00% |
| Units Reported Sold | 0 | 0 | — | 3 | 1 | 200.00% | 1 | 1 | 0.00% |
| Sell / List Ratio | 0.00% | — | — | 33.33% | 16.67% | 99.94% | 14.29% | 25.00% | -42.84% |
| Reported Sales Dollars | $0 | $0 | — | $2,235,000 | $1,350,000 | 65.56% | $725,000 | $1,350,000 | -46.30% |
| Average Sell Price / Unit | $745,000 | $1,350,000 | -44.81% | $725,000 | $1,350,000 | -46.30% | — | — | — |
| Median Sell Price | $725,000 | — | — | $725,000 | — | — | — | — | — |
| Sell Price / List Price | 95.39% | — | — | 96.44% | 90.74% | 6.28% | 96.44% | — | — |
| Days to Sell | 36 | — | — | 56 | — | — | 21 | — | — |
| Active Listings | 0 | 3 | — | — | — | — | — | — | — |
Did my triplex value go up in Vancouver Island (Board Area) in August 2025? No: the average sell price fell to $745,000, -44.81% year over year.
How many days will it take to sell my triplex in Vancouver Island (Board Area)? Typical time to sell was about 36 days.
Source: Vancouver Island Real Estate Board — August 2025. SAR = Sales ÷ Active Listings. MOI = Active ÷ Sales (∞ if no sales). Current-month readings reflect August 2025 for the Board Area.
Quadruplex
| Metric | Current Month | 12 Months to Date | Year to Date | ||||||
|---|---|---|---|---|---|---|---|---|---|
| This Year | Last Year | % Change | This Year | Last Year | % Change | This Year | Last Year | % Change | |
| Units Listed | 2 | 3 | -33.33% | 15 | 12 | 25.00% | 12 | 9 | 33.33% |
| Units Reported Sold | 1 | 0 | — | 7 | 3 | 133.33% | 4 | 3 | 33.33% |
| Sell / List Ratio | 50.00% | 0.00% | — | 46.67% | 25.00% | 86.68% | 33.33% | 33.33% | 0.00% |
| Reported Sales Dollars | $1,750,000 | $0 | — | $7,430,000 | $2,681,000 | 177.14% | $4,690,000 | $2,681,000 | 74.93% |
| Average Sell Price / Unit | $1,750,000 | — | — | $1,061,429 | $893,667 | 18.77% | $1,172,500 | $893,667 | 31.20% |
| Median Sell Price | $1,750,000 | — | — | $1,075,000 | — | — | $1,112,500 | — | — |
| Sell Price / List Price | 94.09% | — | — | 89.88% | 101.18% | -11.17% | 87.57% | 101.18% | -13.45% |
| Days to Sell | 100 | — | — | 76 | 85 | -10.59% | 105 | 85 | 23.53% |
| Active Listings | 6 | 5 | — | — | — | — | — | — | — |
Did my quadruplex value go up in Vancouver Island (Board Area) in August 2025? No change: the average sell price changed to $1,750,000, — year over year.
How many days will it take to sell my quadruplex in Vancouver Island (Board Area)? Typical time to sell was about 100 days.
Source: Vancouver Island Real Estate Board — August 2025. SAR = Sales ÷ Active Listings. MOI = Active ÷ Sales (∞ if no sales). Current-month readings reflect August 2025 for the Board Area.
Manufactured Home
| Metric | Current Month | 12 Months to Date | Year to Date | ||||||
|---|---|---|---|---|---|---|---|---|---|
| This Year | Last Year | % Change | This Year | Last Year | % Change | This Year | Last Year | % Change | |
| Units Listed | 62 | 73 | -15.07% | 732 | 776 | -5.67% | 539 | 565 | -4.60% |
| Units Reported Sold | 45 | 46 | -2.17% | 441 | 420 | 5.00% | 302 | 303 | -0.33% |
| Sell / List Ratio | 72.58% | 63.01% | 15.19% | 60.25% | 54.12% | 11.33% | 56.03% | 53.63% | 4.48% |
| Reported Sales Dollars | $12,558,650 | $16,447,250 | -23.64% | $147,803,025 | $140,048,921 | 5.54% | $98,424,188 | $104,916,332 | -6.19% |
| Average Sell Price / Unit | $279,081 | $357,549 | -21.95% | $335,154 | $333,450 | 0.51% | $325,908 | $346,259 | -5.88% |
| Median Sell Price | $256,000 | $300,000 | — | $291,000 | — | — | — | — | — |
| Sell Price / List Price | 95.42% | 95.48% | -0.06% | 95.73% | 95.79% | -0.06% | 95.92% | 95.93% | -0.01% |
| Days to Sell | 72 | 62 | 16.13% | 71 | 53 | 33.96% | 72 | 56 | 28.57% |
| Active Listings | 196 | 194 | — | — | — | — | — | — | — |
Did my manufactured home value go up in Vancouver Island (Board Area) in August 2025? No: the average sell price fell to $279,081, -21.95% year over year.
How many days will it take to sell my manufactured home in Vancouver Island (Board Area)? Typical time to sell was about 72 days.
Source: Vancouver Island Real Estate Board — August 2025. SAR = Sales ÷ Active Listings. MOI = Active ÷ Sales (∞ if no sales). Current-month readings reflect August 2025 for the Board Area.
Recreational
| Metric | Current Month | 12 Months to Date | Year to Date | ||||||
|---|---|---|---|---|---|---|---|---|---|
| This Year | Last Year | % Change | This Year | Last Year | % Change | This Year | Last Year | % Change | |
| Units Listed | 10 | 6 | 66.67% | 107 | 74 | 44.59% | 86 | 61 | 40.98% |
| Units Reported Sold | 4 | 3 | 33.33% | 37 | 23 | 60.87% | 30 | 17 | 76.47% |
| Sell / List Ratio | 40.00% | 50.00% | -20.00% | 34.58% | 31.08% | 11.26% | 34.88% | 27.87% | 25.15% |
| Reported Sales Dollars | $1,253,000 | $753,000 | 66.40% | $18,646,899 | $8,924,550 | 108.94% | $15,486,900 | $7,160,550 | 116.28% |
| Average Sell Price / Unit | $313,250 | $251,000 | 24.80% | $503,970 | $388,024 | 29.88% | $516,230 | $421,209 | 22.56% |
| Median Sell Price | $278,000 | $315,000 | — | $310,000 | — | — | — | — | — |
| Sell Price / List Price | 89.58% | 95.09% | -5.79% | 92.40% | 89.90% | 2.78% | 92.93% | 89.06% | 4.35% |
| Days to Sell | 57 | 96 | -40.62% | 96 | 101 | -4.95% | 95 | 103 | -7.77% |
| Active Listings | 44 | 33 | — | — | — | — | — | — | — |
Did my recreational property value go up in Vancouver Island (Board Area) in August 2025? Yes: the average sell price rose to $313,250, 24.80% year over year.
How many days will it take to sell my recreational property in Vancouver Island (Board Area)? Typical time to sell was about 57 days.
Source: Vancouver Island Real Estate Board — August 2025. SAR = Sales ÷ Active Listings. MOI = Active ÷ Sales (∞ if no sales). Current-month readings reflect August 2025 for the Board Area.
Land
| Metric | Current Month | 12 Months to Date | Year to Date | ||||||
|---|---|---|---|---|---|---|---|---|---|
| This Year | Last Year | % Change | This Year | Last Year | % Change | This Year | Last Year | % Change | |
| Units Listed | 91 | 104 | -12.50% | 1,219 | 1,288 | -5.36% | 899 | 946 | -4.97% |
| Units Reported Sold | 26 | 28 | -7.14% | 342 | 316 | 8.23% | 226 | 233 | -3.00% |
| Sell / List Ratio | 28.57% | 26.92% | 6.13% | 28.06% | 24.53% | 14.39% | 25.14% | 24.63% | 2.07% |
| Reported Sales Dollars | $16,183,500 | $13,111,700 | 23.43% | $157,992,506 | $146,225,465 | 8.05% | $107,256,181 | $103,733,040 | 3.40% |
| Average Sell Price / Unit | $622,442 | $468,275 | 32.92% | $461,966 | $462,739 | -0.17% | $474,585 | $445,206 | 6.60% |
| Median Sell Price | $402,500 | $380,000 | — | $370,000 | — | — | — | — | — |
| Sell Price / List Price | 94.82% | 94.07% | 0.80% | 93.48% | 93.90% | -0.45% | 93.32% | 95.18% | -1.95% |
| Days to Sell | 133 | 132 | 0.76% | 112 | 112 | 0.00% | 108 | 118 | -8.47% |
| Active Listings | 664 | 645 | — | — | — | — | — | — | — |
Did my land value go up in Vancouver Island (Board Area) in August 2025? Yes: the average sell price rose to $622,442, 32.92% year over year.
How many days will it take to sell my land in Vancouver Island (Board Area)? Typical time to sell was about 133 days.
Source: Vancouver Island Real Estate Board — August 2025. SAR = Sales ÷ Active Listings. MOI = Active ÷ Sales (∞ if no sales). Current-month readings reflect August 2025 for the Board Area.
Other
| Metric | Current Month | 12 Months to Date | Year to Date | ||||||
|---|---|---|---|---|---|---|---|---|---|
| This Year | Last Year | % Change | This Year | Last Year | % Change | This Year | Last Year | % Change | |
| Units Listed | 5 | 2 | 150.00% | 29 | 21 | 38.10% | 24 | 15 | 60.00% |
| Units Reported Sold | 0 | 0 | — | 4 | 6 | -33.33% | 3 | 4 | -25.00% |
| Sell / List Ratio | 0.00% | 0.00% | — | 13.79% | 28.57% | -51.73% | 12.50% | 26.67% | -53.13% |
| Reported Sales Dollars | $0 | $0 | — | $1,955,000 | $3,776,999 | -48.24% | $1,855,000 | $2,934,999 | -36.80% |
| Average Sell Price / Unit | $488,750 | — | -22.36% | $618,333 | $733,750 | -15.73% | — | — | — |
| Median Sell Price | $297,500 | — | — | $310,000 | — | — | — | — | — |
| Sell Price / List Price | 92.83% | — | — | 89.34% | 94.79% | -5.75% | 89.24% | — | — |
| Days to Sell | 119 | — | 26.60% | 94 | — | 33.00% | 133 | — | — |
| Active Listings | 18 | 6 | — | — | — | — | — | — | — |
Did my other residential property value go up in Vancouver Island (Board Area) in August 2025? No: the average sell price fell to $488,750, -22.36% year over year.
How many days will it take to sell my other residential property in Vancouver Island (Board Area)? Typical time to sell was about 119 days.
Source: Vancouver Island Real Estate Board — August 2025. SAR = Sales ÷ Active Listings. MOI = Active ÷ Sales (∞ if no sales). Current-month readings reflect August 2025 for the Board Area.
Source: Vancouver Island Real Estate Board. Data reflect August 2025 Board Area figures.
Top 5 Market Takeaways
- Detached non-acreage homes continue to favour sellers with SAR near 24%.
- Waterfront and acreage listings lean towards buyers due to higher MOI.
- Condo apartments show balanced conditions after earlier volatility.
- Recreational and land segments remain in buyers’ territory with limited absorption.
- Overall Island conditions tilt towards sellers but vary by property type.
For broader monthly and yearly trends, explore the Vancouver Island real estate market page.
Compare Island trends with national and provincial reporting via CREA’s Canadian Housing Market Stats ↗ and the BCREA housing-market articles ↗.
Vancouver Island Home Values in August 2025 – FAQ
Does this report include Greater Victoria?
What do SAR and MOI mean in plain language?
Which property types favour sellers or buyers this month?
Why does MOI sometimes show as ∞ (infinite)?
How should buyers and sellers use these readings?
Categories
- All Blogs (85)
- BC Property Tax Search (10)
- Cost of Living on Vancouver Island (2)
- Living on Vancouver Island (26)
- Log Homes (3)
- Most Affordable Communities in Campbell River (1)
- Most Affordable Communities in Nanaimo (1)
- Most Affordable Communities in Parksville and Qualicum (1)
- Most Affordable Communities in the Comox Valley (1)
- Most Affordable Communities in the Cowichan Valley (1)
- Most Affordable Communities in the North Island (1)
- Most Affordable Communities in the Surrounding Islands (1)
- Most Affordable Communities on Vancouver Island (1)
- Most Expensive Communities in Campbell River (1)
- Most Expensive Communities in Nanaimo (1)
- Most Expensive Communities in Parksville and Qualicum (1)
- Most Expensive Communities in the Comox Valley (1)
- Most Expensive Communities in the Cowichan Valley (1)
- Most Expensive Communities in the North Island (1)
- Most Expensive Communities in the Port Alberni Area (2)
- Most Expensive Communities in the Surrounding Islands (1)
- Most Expensive Communities on Vancouver Island (1)
- People’s Choice Awards (11)
- Real Estate Market Guide (6)
- Vancouver Island Real Estate Market Reports (6)
- Youbou Real Estate Market Reports (3)
Recent Posts


Thinking About Selling or Buying?
Market conditions change quickly and what looks like a sellers’ market today may balance out in the months ahead. If you are planning to sell your home or purchase a property, having the right data and strategy at the right time is key.
I provide custom Market Movement reports and strategy sessions so you understand exactly where your property stands before making your next move. Connect with me below to get started.